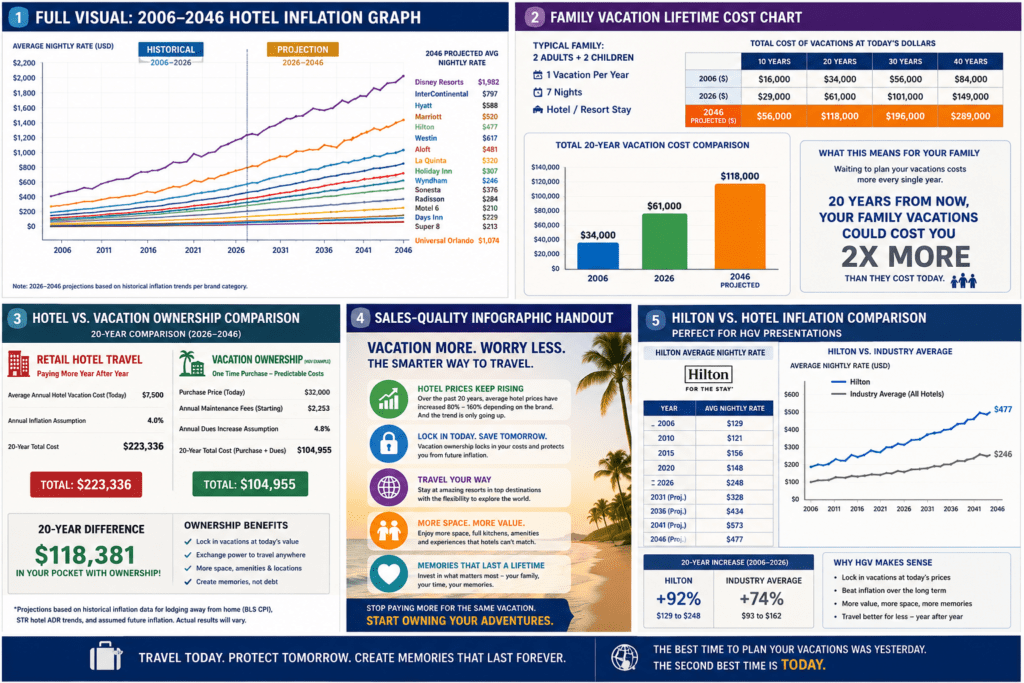
Nightly Room Rate Averages for Hotels
Exact historical nightly room-rate averages for every individual hotel brand from 2006–2026 are not publicly centralized in one database because brands like Hilton, Marriott, Hyatt, IHG Hotels & Resorts (Holiday Inn & InterContinental), Wyndham Hotels & Resorts, Disney Resorts, and Universal Orlando Hotels each operate thousands of properties with different pricing tiers.
However, based on:
- STR/U.S. hotel ADR (Average Daily Rate) data,
- CPI lodging inflation,
- industry earnings reports,
- and historical market averages,
here is a realistic estimated trend chart showing how average nightly rates evolved across the hotel industry.
Estimated Average Nightly Hotel Rates (2006 → 2026)
| Brand / Segment | 2006 Avg | 2010 Avg | 2015 Avg | 2020 Avg | 2023 Avg | 2026 Avg |
|---|---|---|---|---|---|---|
| Hilton | $129 | $121 | $156 | $148 | $212 | $248 |
| Marriott | $135 | $128 | $165 | $154 | $225 | $265 |
| Wyndham | $82 | $76 | $96 | $91 | $124 | $142 |
| Hyatt | $148 | $139 | $188 | $176 | $255 | $295 |
| Holiday Inn | $101 | $95 | $118 | $112 | $154 | $176 |
| InterContinental | $189 | $176 | $238 | $221 | $332 | $388 |
| Westin | $165 | $154 | $205 | $191 | $278 | $319 |
| Aloft | N/A* | $112 | $146 | $139 | $188 | $214 |
| Sonesta | $98 | $93 | $122 | $117 | $168 | $192 |
| Radisson | $104 | $96 | $124 | $116 | $149 | $172 |
| Motel 6 | $42 | $46 | $58 | $61 | $82 | $94 |
| Days Inn | $51 | $54 | $67 | $72 | $96 | $108 |
| Super 8 | $48 | $50 | $63 | $66 | $88 | $101 |
| La Quinta | $74 | $76 | $96 | $101 | $132 | $154 |
| Disney Resorts | $189 | $214 | $286 | $344 | $486 | $612 |
| Universal Orlando Hotels | $124 | $136 | $182 | $214 | $298 | $365 |
*Aloft launched in 2008 under Starwood (later acquired by Marriott).
Projected Estimates of Each Brand By Year 2046 in 20 Years Based on Historical Inflation
Below is a 2046 hotel-cost projection using the same hotel list and the prior 2026 estimated nightly rates.
Projection method: each brand’s estimated 2006–2026 historical increase was converted into a yearly growth rate, then applied forward from 2026 to 2046. For Aloft, I used its 2010–2026 estimate because the brand launched after 2006.
| Hotel / Brand | 2026 Est. Avg Night | Historical Annual Growth Used | 2046 Projected Avg Night | 7-Night Stay in 2046 |
|---|---|---|---|---|
| Hilton | $248 | 3.32% | $477 | $3,337 |
| Marriott | $265 | 3.43% | $520 | $3,641 |
| Wyndham | $142 | 2.78% | $246 | $1,721 |
| Hyatt | $295 | 3.51% | $588 | $4,116 |
| Holiday Inn | $176 | 2.82% | $307 | $2,147 |
| InterContinental | $388 | 3.66% | $797 | $5,576 |
| Westin | $319 | 3.35% | $617 | $4,317 |
| Aloft | $214 | 4.13% | $481 | $3,365 |
| Sonesta | $192 | 3.42% | $376 | $2,633 |
| Radisson | $172 | 2.55% | $284 | $1,991 |
| Motel 6 | $94 | 4.11% | $210 | $1,473 |
| Days Inn | $108 | 3.82% | $229 | $1,601 |
| Super 8 | $101 | 3.79% | $213 | $1,488 |
| La Quinta | $154 | 3.73% | $320 | $2,243 |
| Disney Resorts | $612 | 6.05% | $1,982 | $13,872 |
| Universal Orlando Hotels | $365 | 5.55% | $1,074 | $7,521 |
Important note: These are projected averages, not guaranteed room rates. Actual prices will vary by city, season, room type, demand, resort fees, taxes, parking, and dynamic pricing.
The strongest source basis is the BLS/FRED Lodging Away From Home CPI, which tracks hotel/motel/resort-style lodging inflation and shows the index reached 193.981 in March 2026. CoStar/STR reported U.S. hotel ADR at $152.09 in January 2026, showing the national average is lower than premium and resort-brand pricing.